Practical Work in Geography Class 12 Solutions Chapter 2 Data Processing
Class 12 Practical Work in Geography Chapter 2 NCERT Textbook Questions Solved
1. Choose the right answer from the four alternatives given below:
Question 1(i).
The measure of central tendency that does not get affected by extreme values
(a) Mean
(b) Mean and mode
(c) Mode
(d) Median
Answer:
(d) Median
Question 1(ii).
The measure of central tendency always coinciding with the hump of any distribution is:
(a) Median
(b) Median and Mode
(c) Mean
(d) Mode
Answer:
(b) Median and Mode
Question 1(iii).
A scatter plot represents negative correlation if the plotted values run from:
(a) Upper left to lower right
(b) Lower left to upper right
(c) Left to right
(d) Upper right to lower left
Answer:
(a) Upper left to lower right
2. Answer the following questions in about 30 words:
Question 2(i).
Define the mean.
Answer:
The mean is the value which is derived by summing all the values and dividing it by the number of observations.
Question 2(ii).
What are the advantages of using mode?
Answer:
Mode is the maximum occurrence or frequency at a particular point or value. The biggest advantage of mode is that it is not affected by extreme values. It can be determined even for open ended series.
Question 2(iii).
What is dispersion?
Answer:
The term, ‘dispersion’, refers to the scattering of scores about the measure of central tendency. It is used to measure the extent to which individual items or numerical data tend to vary or spread about an average value. Thus, to get a better picture of a distribution, we need to use a measure of central tendency and of dispersion or variability.
Question 2(iv).
Define correlation.
Answer:
Correlation is basically a measure of relationship between two or more sets of data. It serves a very useful purpose.
Question 2(v).
What is perfect correlation?
Answer:
Perfect correlation means that there is proportional relationship between two variables. If on doubling x, the value of y also gets doubled, it is perfect positive correlation. On the other hand, if on doubling the variable x, the value of y gets halved, it is called perfect negative correlation.
Question 2(vi).
What is the maximum extent of correlation?
Answer:
The value of correlation lies between -1 and +1. Closer it is to zero, weaker is the correlation; closer it is towards ±1, stronger is the correlation. Symbolically -1≤ r ≤ +1.
3. Answer the following questions in about 125 words.
Question 3(i).
Explain relative positions of mean, median and mode in a normal distribution and skewed distribution with the help of diagrams.
Answer:
(a) Normal Curve: In this curve, highest frequency is at the centre and both tails on the left and right hand side are in identical fashion. It is a unimodal curve in which mean, median and mode are equal. It is also known as a bell¬shaped or symmetrical curve. It is shown below: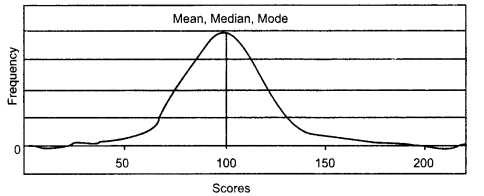
(b) Positively Skewed Curve: It is a symmetrical curve which has a tail on the right hand side of the graph and frequencies are more for the lower values of the data. These histograms have the curve on the left side of the distribution. If the right tail is longer, the mass of the distribution is concentrated on the left. It has relatively few low values. It is shown below: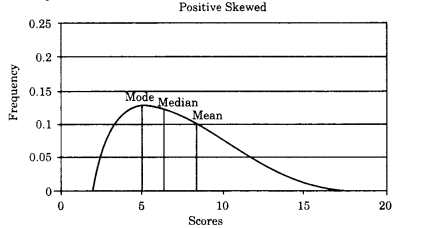
(c) Negatively Skewed Curve: It is a symmetrical curve which has a tail on the left hand side of the graph and frequencies are more for the higher values of the data. The left tail is longer, the mass of the distribution is concentrated on the right of the figure. It has relatively few low values. The distribution is said to be left-skewed. It is shown below: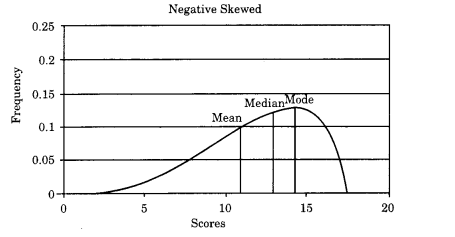
Question 3(ii).
Comment on the applicability of mean, median and mode (Hint: from their merits and demerits)
Answer:
Mean:
- It is the simplest among all the measures of central tendency.
- It is based on all the items in a series. Hence, it is a representative value of different items.
- It is a value. It has no scope for estimated values.
- It is a stable form of central tendency.
- It can be used for comparison.
Median:
- Median is not affected by the extreme values of the series.
- For finding median, only the middle values and their units are sufficient.
- Median can also be determined through the graphic representation of data.
- Median value is always certain in a series.
- Median value is a real value.
Mode:
- Mode is a very simple measure of central tendency.
- It is less affected by extreme and marginal values.
- Mode is the best representation of the series.
- It can also be determined graphically.
Question 3(iii).
Explain the process of computing Standard Deviation with the help of an imaginary example.
Answer:
Standard deviation (SD) is the most widely used measure of dispersion. It is defined as the square root of the average of squares of deviations. It is always calculated around the mean. The standard deviation is the most stable measure of variability and is used in so many other statistical operations. The Greek character a denotes it.
Steps:
- To obtain SD, deviation of each score from the mean (x) is first squared (x2).
- It makes all negative signs of deviations positive. It saves SD from the major criticism of mean deviation which uses modulus x. Then, all of the squared deviations are summed -x2
- (care should be taken that these are not summed first and then squared).
- This sum of the squared deviations (x2) is divided by the number of cases and then the square root is taken. Therefore, Standard Deviation is defined as the root mean square deviation.
Calculate the standard deviation for the following distribution:
Solution:
The method of obtaining SD for grouped data has been explained in the table below. The initial steps upto column 4, are the same as those we followed in the computation of the mean for grouped data. We begin with deviation value of zero has been assigned to the group. Like wise other deviations are determined. Values in column 4(fx’) are obtained by the multiplication of the values in the two previous columns. Values in column 5(fx’ 2) are obtained by multiplying the values given in column 3 and 4. Then various columns have been summed.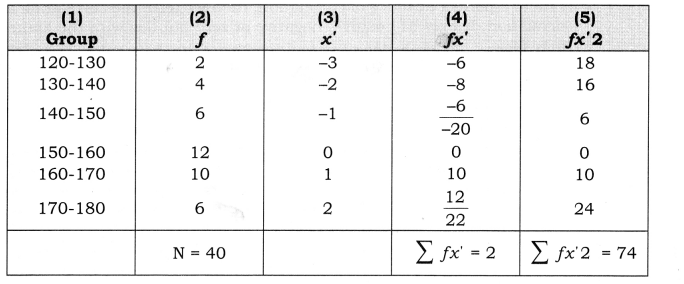
The following formula is used to calculate the Standard Deviation:![]()
Question 3(iv).
Which measures of dispersion is the most unstable statistic and why?
Answer:
Range is the most unstable statistic because:
- Range is not based on all the terms. Only extreme items reflect its size. Hence, range cannot be completely representative of the data as all other middle values are ignored.
- Due to the above reason, range is not a reliable measure of dispersion.
- Range does not change even the least even if all other, in between, terms and variables are changed.
- Range is too much affected by fluctuation of sampling. Range changes from sample to sample. As the size of sample increases range increases and vice-versa.
- It does not tell us anything about the variability of other data.
- For open-end intervals, range is indeterminate because lower and appear limits of first and last interval are not given.
Question 3(v).
Write a detailed note on the degree of correlation.
Answer:
Through the coefficient of correlation, we can measure the degree or extent of the correlation between the two variables. On the basis of the coefficient of correlation, we can also determine whether the correlation is positive or negative and also its degree or extent.
Perfect correlation: If two variables change in the same direction and in the same proportion, the correlation between the two is perfect positive. According to Karl Pearson, the coefficient of correlation, in this case, is +1. On the other hand, if the variables change in the opposite direction and in the same proportion, the correlation is perfect negative. Its coefficient of correlation is -1. In practice we rarely come across these types of correlations.
Absence of correlation: If two series of two variables exhibit no relations between them or change in variable does not lead to a change in the other variable, then we can firmly say that there is no correlation or absurd correlation between the two variables. In such a case the coefficient of correlation is 0.
Limited degrees of correlation: If two variables are not perfectly correlated or is there a perfect absence of correlation, then we term the correlation as Limited correlation. It may be positive, negative or zero but lies with the limits ± 1.
High degree, moderate degree or low degree are the three categories of this kind of correlation. The following table reveals the effect (or degree) of coefficient or correlation.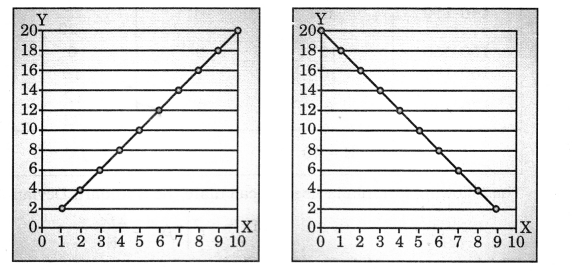
Question 3(vi).
What are various steps for the calculation of rank order correlation?
Answer:
Step 1: Rank both sets of data. Give the largest value rank 1, the second largest value rank 2, etc.
Step 2: Calculate the differences in the ranks, d.
Step 3: Work out the squares of the differences (d2).
Step 4: Calculate the sum of these squared differences,
Step 5: Spearman’s Rank Correlation Coefficient is found by substituting this sum into the following formula:
where n is how many pairs of data you have.
Example: Find rank correlation from data given below: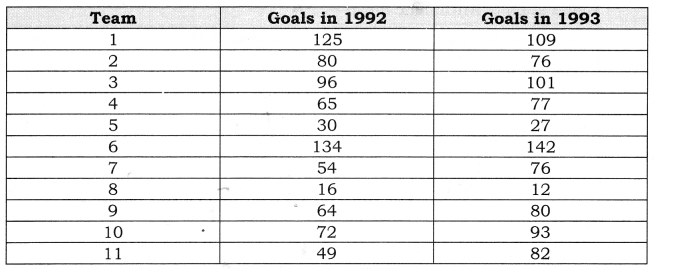
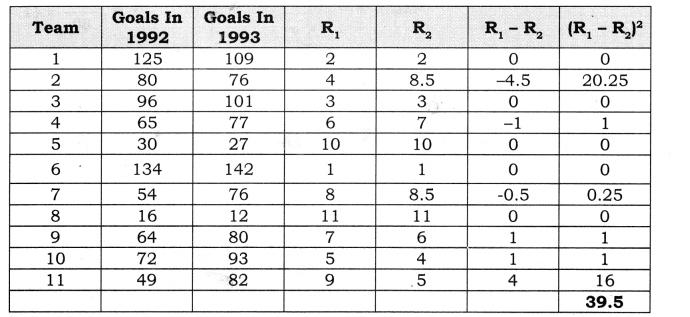
So, for this set of data, the finished equation looks like this: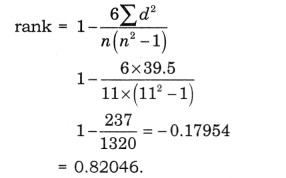
High Positive Correlation.
Activity
Question 1.
Take an imaginary example applicable to geographical analysis and explain direct and indirect methods of calculating mean from ungrouped data.
Answer:
From the following data of the marks obtained by 60 students of a class.
Solution-1 (Direct Method):
Calculation of Arithmetic mean:
Here N= totlal frequency = 60
Hence,
Average Marks=41
Solution-2 (Short Cut Method):
Calculation of Arithmetic mean: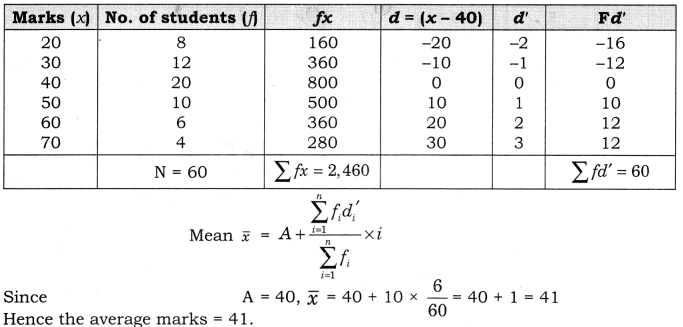
Question 2.
Draw scatter plots showing different types of perfect correlations
Answer:
Perfect Positive Correlation: If all points lie on a rising straight line the correlation is perfectly positive and r=+1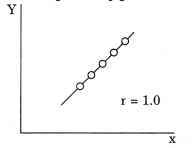
Perfect Negative Correlation: If all points lie on a falling straight line the correlation is perfectly negative and r = -1.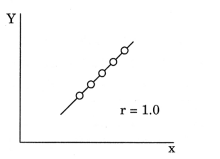
High degree of Positive Correlation:
If the points lie in a narrow strip rising upwards, the correlation is high degree of positive.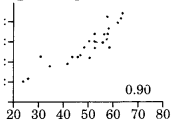
High degree of Negative Correlation:
If the points lie in a narrow strip falling downwards, the correlation is high degree of negative.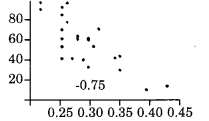
Low degree of Positive Correlation:
If the point are spread widely over a broad strip rising upwards, the correlation is low degree positive.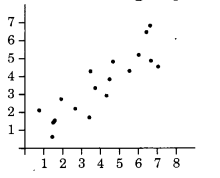
Low degree of Negative Correlation:
If the points are spread widely over a broad strip falling downwards, the correlation is low degree negative.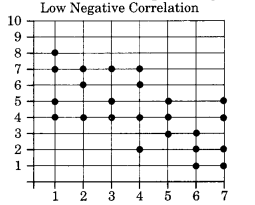
Class 12 Practical Work in Geography Chapter 2 NCERT Extra Questions
Class 12 Practical Work in Geography Chapter 2 Very Short Answer Type Questions
Question 1.
What measures are adopted to find correlation?
Answer:
Correlation is measured either by Karl Pearson’s method or by Spearman’s rank correlation.
Question 2.
What do you mean by median?
Answer:
The median is defined as the number in the middle of a given set of numbers arranged in order of increasing magnitude. When given a set of numbers, the median is the number positioned in the exact middle of the list when you arrange the numbers from the lowest to the highest. The median is the middle most or central value of the observations made on a variable when the values are arranged either in ascending order or descending order.
Question 3.
What do you mean by mode?
Answer:
The mode is defined as the element that appears most frequently in a given set of elements. Using the definition of frequency given above, mode can also be defined as the element with the largest frequency in a given data set.
Question 4.
Name the most stable and unstable measure of dispersion.
Answer:
The most stable measure of dispersion is standard deviation and most unstable is range.
Question 5.
Name the most stable and unstable measure of central tendency.
Answer:
The most stable measure of central tendency is median and the most unstable measure is mode.
Question 6.
Which measures are affected by the extreme values?
Answer:
In measures of central tendency, mean and in measures of dispersion, range is most affected by the extreme values.
Question 7.
What are different types of mode?
Answer:
There are three types of mode
- Unimodal: A series of data having one mode is called ‘unimodal’.
- Bimodal: A series of data having two modes is called ‘bimodal’.
- Multimodal: Some series may also have several modes and be called ‘multimodal’.
Question 8.
Who adopted a scientific method to measure correlation?
Answer:
Karl Pearson was the first person to measure correlation scientifically.
Question 9.
Find mean from the data given below:
24, 32, 40, 44, 33, 27, 14, 56, 54.
Answer:
Question 10.
Temperature of a place is given for 12 months. Find the average temperature.
9, 12, 18, 22, 35, 36, 24, 23, 19, 17, 14, 11
Answer:
Class 12 Practical Work in Geography Chapter 2 Short Answer Type Questions
Question 1.
What are the different measures of central tendency?
Answer:
A measure of central tendency is a single value that attempts to describe a set of data by identifying the central position within that set of data. As such, measures of central tendency are sometimes called measures of central location. They are also classed as summary statistics. The mean (often called the average) is most likely the measure of central tendency that you are most familiar with, but there are others, such as the median and the mode.
The mean, median and mode are all valid measures of central tendency, but under different conditions, some measures of central tendency become more appropriate to use than others. In the following sections, we will look at the calculation of mean in different types of series, combined mean, weighted mean, finding missing frequencies and correcting mean.
Question 2.
What do you mean by mean? What measures are adopted to find it?
Answer:
The mean (or average) is the most popular and well known measure of central tendency. It can be used with both discrete and continuous data, although its use is most often with continuous data. The mean is equal to the sum of all the values in the data set divided by the number of values in the data set. So, if we have n values in a data set and they have values x1, x2, …. xn, the sample mean, usually denoted by x (pronounced xbar), is:![]()
It is calculated by two methods: (a) Direct method and (b) Indirect method.
Question 3.
What do you mean by correlation?
Answer:
A statistical technique that is used to analyse the strength and direction of the relationship between two quantitative variables is called correlation analysis. The coefficient of correlation is a number that indicates the strength (magnitude) and direction of statistical relationship between two variables. The strength of the relationship is determined by the closeness of the points to a straight line when a pair of values of two variables are plotted on a graph. A straight line is used as the frame of reference for evaluating the relationship. The direction is determined by whether one variable generally increases or decreases when the other variable increases.
Question 4.
Give formula for finding mean.
Answer:
Solution-1 (Direct Method):
If x1,x2, x3, xn are ‘n’ individual observed values of a variable x, then the A.M is denoted by % and is defined as
Solution-2 (Short Cut Method):
Short Cut method: Under this method the formula for calculating mean is
Question 5.
From the figures given below, find mean by direct and by direct and indirect methods.
Answer:
Calculation of Arithmetic mean by Direct Method: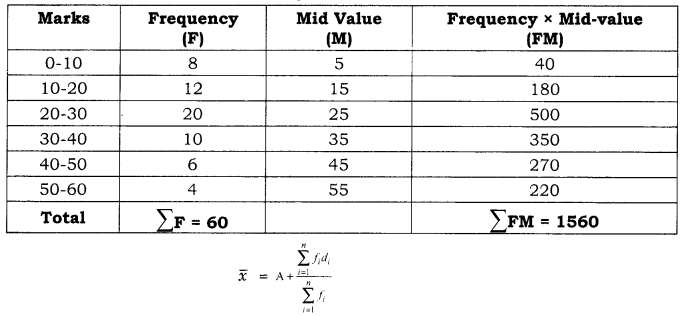
= 1560/60 = 26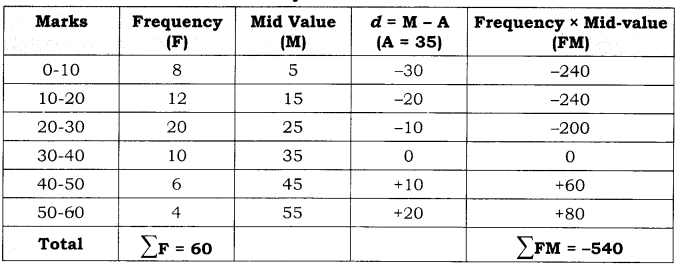
Calculation of Arithmetic mean by Short Cut Method: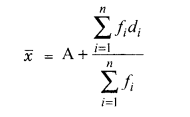
= 35 – 540/60 = 26
Question 6.
From the given ungrouped data, find median.
62, 68, 53, 57, 20, 30, 32, 45, 72, 77, 81
Answer:
From the definition o median, we should be able to tell that the first step is to rearrange the fiven set of numbers in order to increase magnitude, i.e. from the lowest to the highest
Class 12 Practical Work in Geography Chapter 2 Long Answer Type Questions
Question 1.
Explain the difference between standard deviation and coefficient of variation.
Answer:
Standard deviation is superior to other measures because of its merits showing the variability which is important for statistical data. The standard deviation enjoys many qualities of a good measure of dispersion.
In mean deviation we take the sum of deviations from actual mean after ignoring + – signs. In standard deviation, we get the same results without ignoring signs.
In this case deviation from actual mean are wquared, and hence every term is positive.![]()
1. It is a pure number and the unit of observations is not mentioned with its value. It is written in percentage form like 20% or 25%. When its value is 20%, it means that when the mean of the observations is assumed equal to 100, their standard deviation will be 20.
2. in their means or differ in the units of measurement. The wages of workers may be in dollars and the consumption of meat in their families may be in kilograms. The standard deviation of wages in dollars cannot be compared with the standard deviation of amounts of meat in kilograms. Both the standard deviations need to be converted into coefficient of variation for comparison.
Question 2.
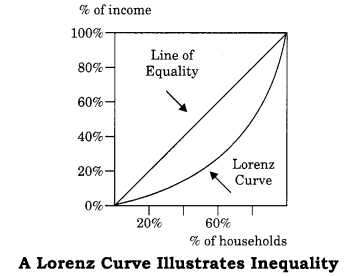
What do you mean by Lorenz Curve?
It was given by Dr. Max. O. Lorenz. It is a graph on which the cumulative percentage of total national income (or some other variable) is plotted against the cumulative percentage of the corresponding population (ranked in increasing size of share). The extent to which the curve sags below a straight diagonal line indicates the degree of inequality of distribution.
Steps to Plot a Lorenz Curve:
- Cumulate both values and their corresponding frequencies.
- Find the percentage of each of the cumulated figures taking the grand total of each corresponding column as 100.
- Represent the percentage of the cumulated frequencies on X axis and those of the values on the Y axis.
- Draw a diagonal line designated as the line of equal distribution.
- Plot the percentages of cumulated values against the percentages of the cumulated frequencies of a given distribution and join the points so plotted through a free hand curve.
Example: From the following details of monthly income, draw a Lorenz curve.

Solution:
Question 3.
Explain merits and demerits of arithmetic mean.
Answer:
Merits of Arithmetic Mean:
- Arithmetic mean is most popular among averages used in statistical analysis.
- It is very simple to understand and easy to calculate.
- The calculation of arithmetic mean is based on all the observations in the series.
- The arithmetic mean is responsible for further algebraic treatment.
- It is strictly defined.
- It provides a good means of comparison.
- It has more sampling stability.
Demerits of Arithmetic Mean:
- The arithmetic mean is affected by the extreme values in a series.
- In case of a missing observation in a series it is not possible to calculate the arithmetic mean.
- In case frequency distribution with open end classes the calculation of arithmetic mean is theoretically impossible.
- The arithmetic mean is an unsuitable average for qualitative data.
Question 4.
Explain merits and demerits of median.
Answer:
According to Croxton and Cowden, “The median is generally defined as the value which divides the distribution so that an equal number of items is on either side of it.”
Merits:
- The median is useful in case of frequency distribution with open-end classes.
- The median is recommended if distribution has unequal classes.
- Extreme values do not affect the median as strongly as they affect the mean.
- It is the most appropriate average in dealing with qualitative data.
- The value of median can be determined graphically whereas the value of mean can not be determined graphically.
- It is easy to calculate and understand.
Demerits:
- For calculating median, it is necessary to arrange the data, whereas other averages do not need arrangement.
- Since it is a positional average its value is not determined by all the observations in the series.
- Median is not capable for further algebraic calculations.
- The sampling stability of the median is less as compared to mean.
Question 5.
Explain merits and demerits of mode.
Answer:
Mode is the most frequent item in the series.
Merits:
- It is easier to calculate and simpler to understand.
- It is not affected by the extreme values.
- The value of mode can be determined graphically.
- Its value can be determined in case of open-end class interval.
- The mode is the most representative of the distribution.
Demerits:
- It is not suitable for further mathematical treatments.
- The value of mode cannot always be determined.
- The value of mode is not based on each and every items of the series.
- The mode is strictly defined.
- It is difficult to calculate when one of the observations is zero or the sum of the observations is zero.
Question 6.
What is included in measures of dispersion? What is measured through it?
Answer:
Measures of central tendency do not reveal how values in the data set are dispersed (spread or scattered) on each side of the central value. The dispersion of values is indicated by the extent to which these values tend to spread over an interval rather than cluster closely around an average. The statistical techniques to measure such dispersion are of two types:
1. Techniques that are used to measure the extent of variation or the deviation (also called degree of variation) of each value in the data set from a measure of central tendency, usually the mean or median. Such statistical techniques are called measures of dispersion (or variation).
2. Techniques that are used to measure the direction (away from uniformity or symmetiy) of variation in the distribution of values in the data set. Such statistical techniques are called measures of skewness.
It includes the following:
- Range
- Question uartile Deviation
- Mean Deviation
- Standard Deviation and Co-efficient of Variation (C.V.)
- Lorenz Curve
Question 7.
Give formula for finding median.
Answer:
Step-1:
Arrange the data in ascending or descending order of magnitude or find cf.
Step-2:
Case (i) If the number of observations is odd then median is the
Case (ii) If the number of observations is even then the median is the mean of
It is median in individual series.
But in case of continuous series, we need following steps further.
- Now look at the cumulative frequency column and find that total which is either equal to
n+12 or next higher to that and determine the value of the variable
corresponding to it. That gives the median class. - The median of a continuous series can be calculated by the below interpolation formula.

Where l1 = lower limit of the median class.
f = frequency corresponding to the median class
n/2 = Total frequency divided by 2.
n= total frequency
C = cumulative frequency of the class preceding to the median class
i = Class Interval of Median Class.
Question 8.
Give formula for finding mean deviation.
Answer:
Mean Deviation in Individual Series:
Mean Deviation in Discrete Series:
If the data is grouped in a frequency table, the expression the mean deviation is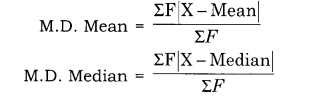

Class 12 Practical Work in Geography Chapter 2 Viva Questions
Question 1.
What is the minimum and maximum value of correlation?
Answer:
1< R<+1
Question 2.
What does perfect correlation mean?
Answer:
Perfect positive correlation means that double the X, Y will be doubled and vice- versa. Perfect negative correlation means that double the X and Y will be halved and vice-versa.
Question 3.
What is the relationship between mean, median and mode in a normal distribution?
Answer:
Mean = median = mode
Question 4.
What is the relationship between mean, median and mode in skewed distribution?
Answer:
Mode = 3 Median – 2 Mean
Question 5.
Who gave the concept of Lorenz Curve?
Answer:
It was given by Dr. Max. O. Lorenz.
Question 6.
What does a zero correlation mean?
Answer:
Zero correlation means that with an increase/decrease in X, Y does not change.
Question 7.
What is the implication of line of equality?
Answer:
Line of equality shows that there is no unevenness in distribution. Farther is the distribution from this line greater is the inequality.
Data Processing Notes
- A number of statistical techniques are used to analyse the data. Most important of these are:
- Measures of Central Tendency
- Measures of Dispersion
- Measures of Relationship
- The number denoting the central tendency is the representative figure for the entire data set because it is the point about which items have a tendency to cluster. Measures of central tendency are also known as statistical averages. There are three measures of central tendency: mean, median and the mode.
- • The following methods are used as measures of dispersion:
- Range
- Quartile Deviation
- Mean Deviation
- Standard Deviation and Co-efficient of Variation (C.V.)
- Lorenz Curve
- Measures of correlation include: Karl Pearson’s Correlation coefficient, Spearman’s rank correlation.
- There are two methods of measuring mean: Direct method and Indirect method. Both of these can be used for grouped data as well as ungrouped data.
- Mean is considered to be vague and unreliable because many times the value of mean is not equal to any of the value of data. For example, if marks of five students are 35, 46, 54, 52 and 68 then mean will be equal to

- These are not the marks of any of the five students.
- Mean is of three types:
- Arithmetic Mean
- Geometric Mean
- Harmonic Mean
- Direction of Correlation: It is our common experience that an input is made to get some output. There could be three possibilities.
- With the increase in input the output also increases. It is called positive correlation.
- With the increase in the input the output decreases. It is called Negative correlation.
- Change in the input does not lead to change in the output. It is called Zero correlation.
Data Processing Important Terms
- Mean: The mean is the value which is derived by summing all the values and dividing it by the number of observations.
![]()
- Median: The median is the value which divides the arranged series into two equal halves. It is independent of the actual value.
- Mode: The value that occurs most frequently in a distribution.
- Dispersion: The term dispersion refers to the scattering of scores about the measure of central tendency. It is used to measure the extent to which individual items or numerical data tend to vary or spread about an average value.
- Range: Range (R) is the difference between maximum and minimum values in a series of distribution. This way it simply represents the distance from the smallest to the largest score in a series. It can also be defined as the highest score minus the lowest score.
- Quartile Deviation (Q.D): The Quartile Deviation is a slightly better measure of absolute dispersion than the range. But it ignores the observation on the tails. If we take different samples from a population and calculate their quartile deviations, their values are quite likely to be sufficiently different. This is called sampling fluctuation. It is not a popular measure of dispersion. The quartile deviation calculated from the sample data does not help us to draw any conclusion (inference) about the quartile deviation in the population.
- Mean Deviation: It is also called an Absolute Deviation. Absolute deviation for a given data set is defined as the average of the absolute difference between the elements of the set and the mean (average deviation) or the median element (median absolute deviation). The mean deviation or the average deviation is defined as the mean of the absolute deviations of observations from some suitable average which may be the arithmetic mean, the median or the mode.
- Standard Deviation: Standard Deviation (SD) is the most widely used measure of dispersion. It is defined as the square root of the average of squares of deviations. It is always calculated around the mean. Standard Deviation is defined as the root mean square deviation.


0 Comments
Please Comment